
For the past 30 years, I have worked at the enterprise level in digital and search marketing. Working for big companies, you need to be creative to get buy-in and advance your projects and ideas, requiring me to develop several “creative reports” to generate executive attention. The following models will hopefully help you make your case for the strategic value of Search Marketing.
Demonstrate The Cost of Not Ranking – Paying for Free Traffic
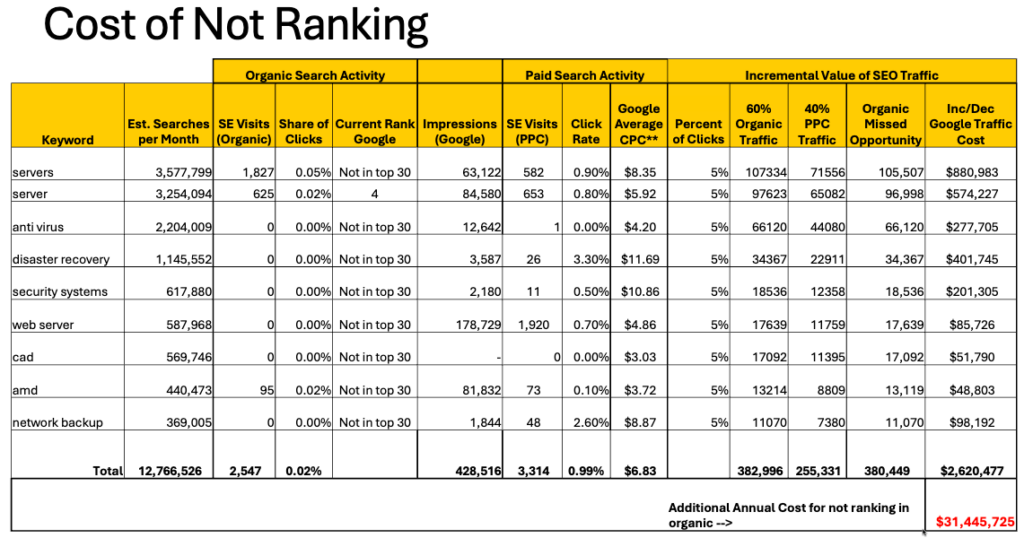
This is one of the first models I built out of frustration. I was part of a presentation team that flew to Germany for the pitch. We had identified both organic search and paid search optimization as critical success factors. The CMO was so uninterested in SEO that he told me to leave the pitch meeting. He ultimately allowed me to stay but did not want to hear about SEO. I was pretty frustrated by his comments. As the meeting progressed, he talked about costs and ROI, and that paid search was costing them a fortune, blah, blah, blah. I had been doing co-optimization models and thought – how much paid traffic is he paying for when he could get it for free? If he is willing to pay frustratingly large sums in paid search, he understands Search. The business development guy softened him up over lunch and let me present my thoughts and models on co-optimization. He agreed to give me 15 minutes.
I opened with this slide, showing that he was missing out on “free clicks.” He ONLY needed to make minor changes and adapt a few elements on his templates to get this traffic. In his case, he must buy that traffic because they have no representation in search. I asked the question: what if we get a simple 5% of the search volume (a click on 1 out of 20 results)? Currently, he was not getting any traffic and was forced to buy that potentially “free traffic” – that same traffic was costing him $2.6 million a month or more than $31 million a year. This caught his attention. He had never considered the cost of buying the clicks that he could get for free. We explained that he can continue to spend that, but what if we shifted $100k toward optimizations that could offset even a fraction of that cost?
He could clearly see the search volume for the words he was buying, where he was not represented in organic search, meaning he had to pay for 100% of the traffic. What if any of those paid clicks shifted to organic? We took conservative estimates. Putting it into a context he could understand, with missed opportunity and the actual cost associated with not capturing organic traffic, was the mental model he needed to open his mind and budget to organic.
Opportunity Realized – No BS Report
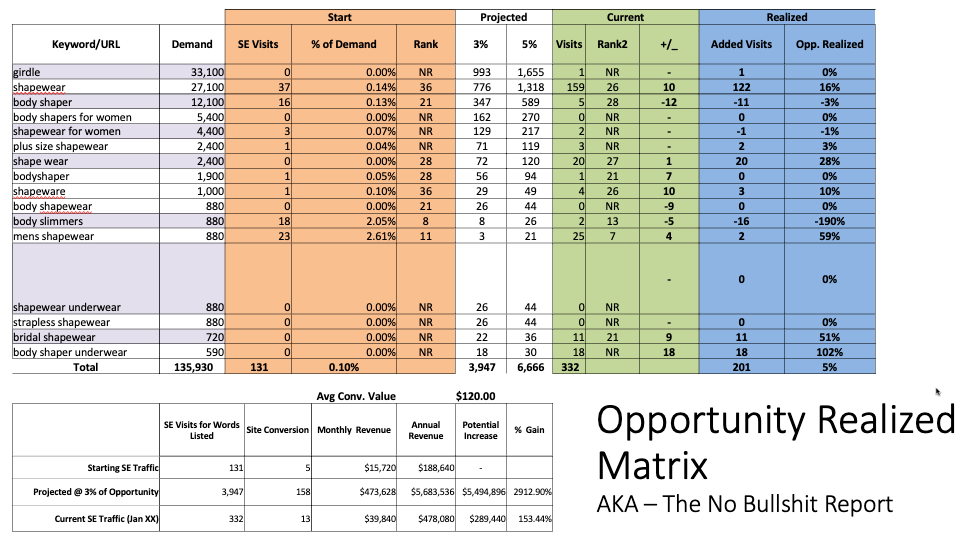
One of my favorite reports, and the first we built into DataPrizm back in the day, was the No Bullshit Report that, for politically correct reasons, we renamed the Opportunity Realized Report. This report used the missed opportunity Matrix below to demonstrate how much of that opportunity we have captured. The mandate for this report came from a client whose boss wanted to use his friend’s digital agency. Using this report, we could demonstrate how much of the projected traffic, IF the SEO recommendations were implemented, was captured.
A straightforward report; the orange was the stats at the start of the project. The white is what we predicted. If we can make the recommended changes, we could capture 3 to 5% of the missed opportunity. The green section showed current performance, and the blue section showed the number of added visits and the predicted share. We showed increases, decreases, and no change, reflecting the reality of what we were generating. This pushed the team to consider performance and activities that would help capture what was expected as they worked on the project. The revenue contribution section below the matrix shows the volume of revenue derived from the incremental.
This single report kept us honest and on our toes. If we were not moving the performance as we “predicted,” we needed to know. The client can see the direct contribution of our efforts on their business performance. This is why clients get frustrated: many agencies show amazing opportunity models, but the results never materialize.
Demonstrate the Cost of Inaction
We built this report one day after receiving pushback on our NO BS Report. A manager actually used this report as his reason to try and terminate his project. He was frustrated that we had not delivered the revenue and traffic we had predicted in our models, and the model supported his statements.
The problem was that his team was not implementing any of the recommendations. We created a worksheet and estimated the traffic improvement for the various tasks. We then used the @now command to calculate the number of backlog days for tasks and multiplied it by the traffic for that period. In most cases, the tasks were 3 to 6 months backlog, with a few over two years old. By tying task inaction to revenue, we had something we could point to that put the focus on the lack of results. We had an internal code name for this report, ITKMP, which means “IT Killed My Performance” report.
There were two key tasks that required template edits, and they were over 800 days old. Using our agreed ratios, this meant that between the two tasks we had missed an opportunity of $1.6 million dollars. We did our part; we identified the issues, but their delay was costing them money. We were able to show incremental gains for nearly every action. Sure enough, once the CMO and CTO saw this report, they accelerated the fix, and our prediction model performed identically.

Demonstrate Missed Opportunities – Missed Opportunity Matrix
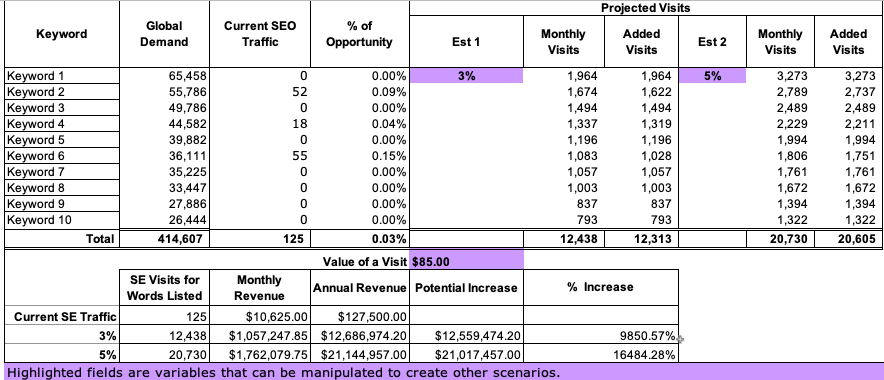
This is one of the early versions of the Missed Opportunity models we used to motivate brands to make organic search changes based on the volume of opportunities they were missing. We used 3% and 5% as our opportunity share. With this client, their average order was $85. Getting 3% of the search volume for the things they sell would increase revenue from $127k annually to $12.5 million. This is a great motivator, especially when you can demonstrate why they are not ranking well.
Demonstrate Revenue Contribution
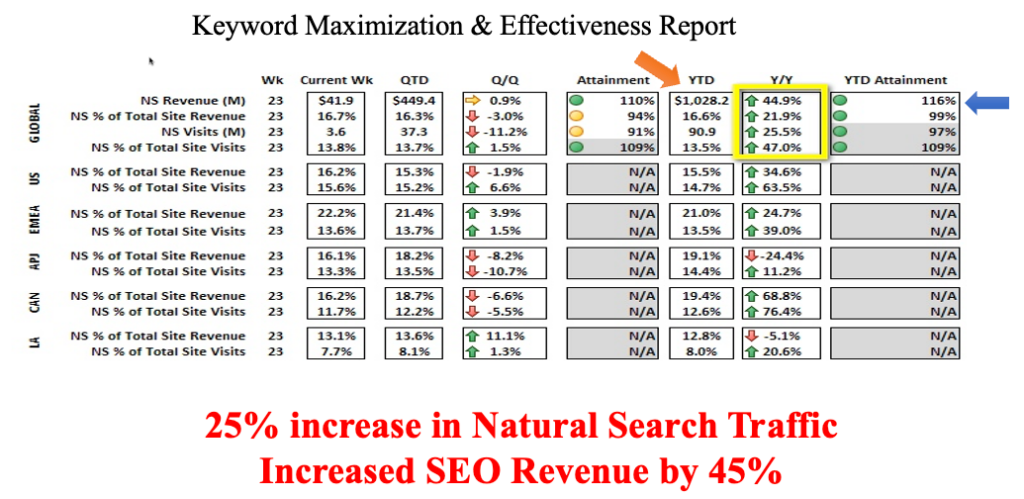
The screen below was a model we created with a client to show the revenue contribution of organic search. The official public name is the Keyword Maximization & Effectiveness Report (KMEA) to show the actual revenue contribution of organic. The real name of this report is the “Keep My Ass Employed” report. It came from one of our larger clients, who called my team to task. We were not delivering the traffic and sales we had modeled. He came to our office and told the team to do better: we had one simple job: “To Keep His Ass Employed,” and the only way that would happen was if he hit the revenue contribution numbers. He was paying and depending on our expertise for this. So if we failed, he failed too. This report, similar to the Opportunity Realized report, kept the entire team focused on activities that would directly impact it.
Demonstrate Revenue Potential
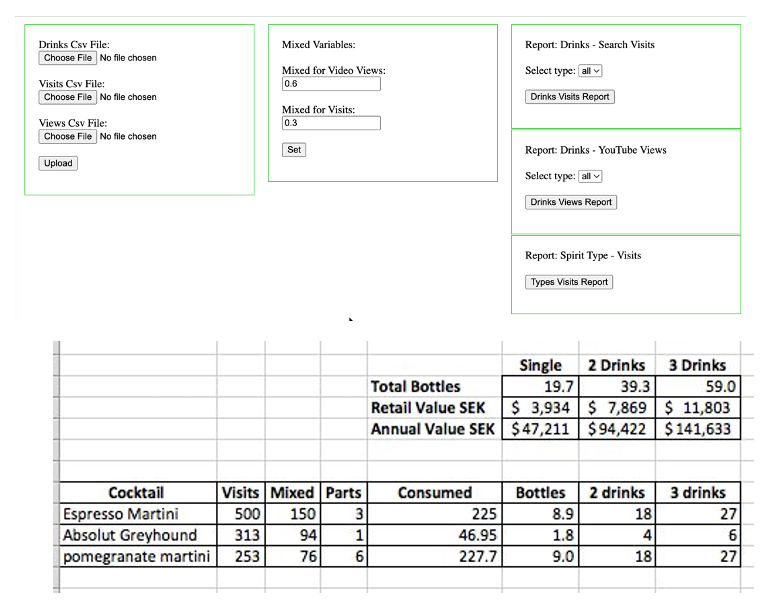
The screen capture below was used to convince management that there was both awareness and revenue value to a cocktail website. Management would shut it down because it was not delivering traffic or unique value. The site had potential if we gave it some attention. I created a small application called the “Cocktails to Bottles” model. Using the same illusory methods as other “faith-based marketing” tactics like TV and print, we simply wanted some cause-and-effect data point that could encourage management to reconsider.
We combined data from organic search visits, the ratio of “viewed to made it” clicks in our app (we asked, then did they make the drink they reviewed), and the amount of alcohol in each drink to demonstrate that the more people who look at the recipe that uses our spirit, the more bottles we could sell. It was a bit cheesy, but it did work to both secure a reprieve for the site and plant the seed that there is a correlation between people looking for drinks and needing the alcohol they require.
Ultimately, it worked, and the site drove millions of visits each month, earning numerous digital and search awards, including being the first Search-related entry to be shortlisted for a Cannes Lion.
Motivating Change
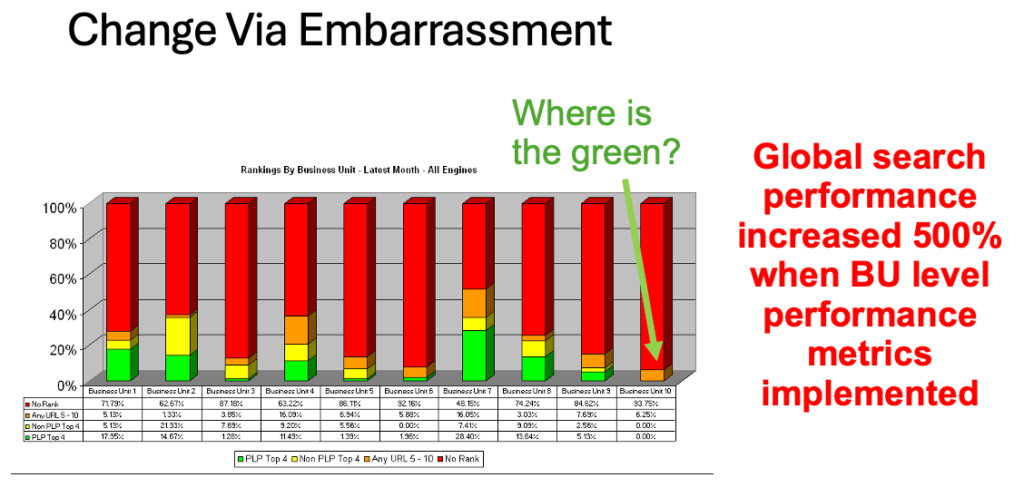
This is another chart presented at a C-Suite meeting to motivate department managers to engage in Search. Despite a global mandate, not all were engaging. This chart reflects the performance of business units. The column on the far right caught the CEO’s attention; the CEO asked, “Where is the green?” This led to it being called the “Getting Green Report,” with a similar version for revenue.
Missed Opportunity Insights
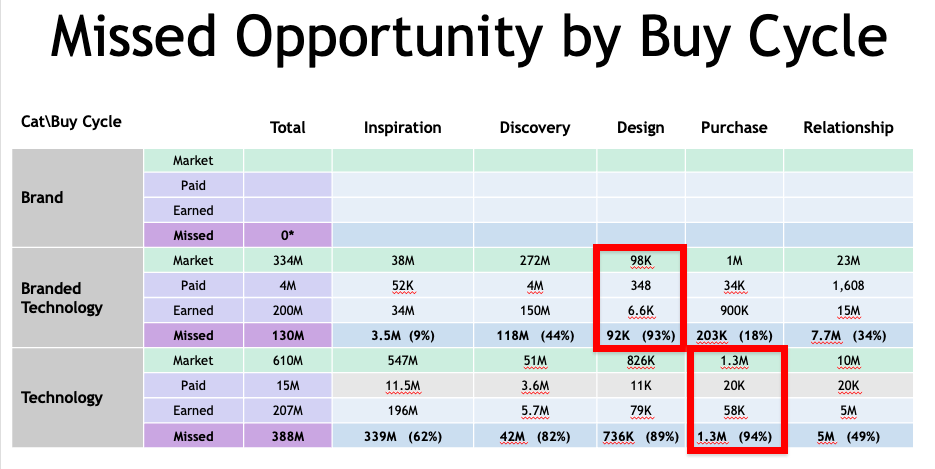
We were asked to expand the Missed Opportunity Models to identify insights across buy cycles, product categories, and audience types. We mined over 10 million search queries, assigning them to categories, and integrated paid and organic data, specific rank, and click data. We identified significant gaps in paid and organic search across all phases of their buying cycle.
The company had a significant initiative to map and capture across the customer journey. We identified 90+ percent gaps in the design phases (selecting technology packages) and the purchase phase, which is critical for sales. This set the stage for a two-year project to capture this gap, estimated at over $100 million. That revenue potential identified Search as a strategic driver, thereby elevating it across the board to mission-critical status.
Strategic Insight Challenges
One of the challenges I never anticipated as I tried to use data to tell stories and motivate action was how different constituents might react to the data; in the site search mining exercise, this elicited several responses. It was interesting to see the pushback against the opportunity from those needing extra work and those who may experience some revenue cannibalization.
Senior Management: They saw this as a revenue opportunity and wanted to know how quickly we could generate new or modify content to capture this potential revenue.
Content Team: They were panicking and overwhelmed by how much content needed to be created or adapted, and how they would do it. The manager also expressed concern that they might be criticized for failing to detect this merchandising opportunity.
Onsite Teams – The onsite team was concerned this might impact revenue generated at the location by minimizing upsells. The manager said they can often upsell customers, which may decrease if they prebuy, affecting their performance.